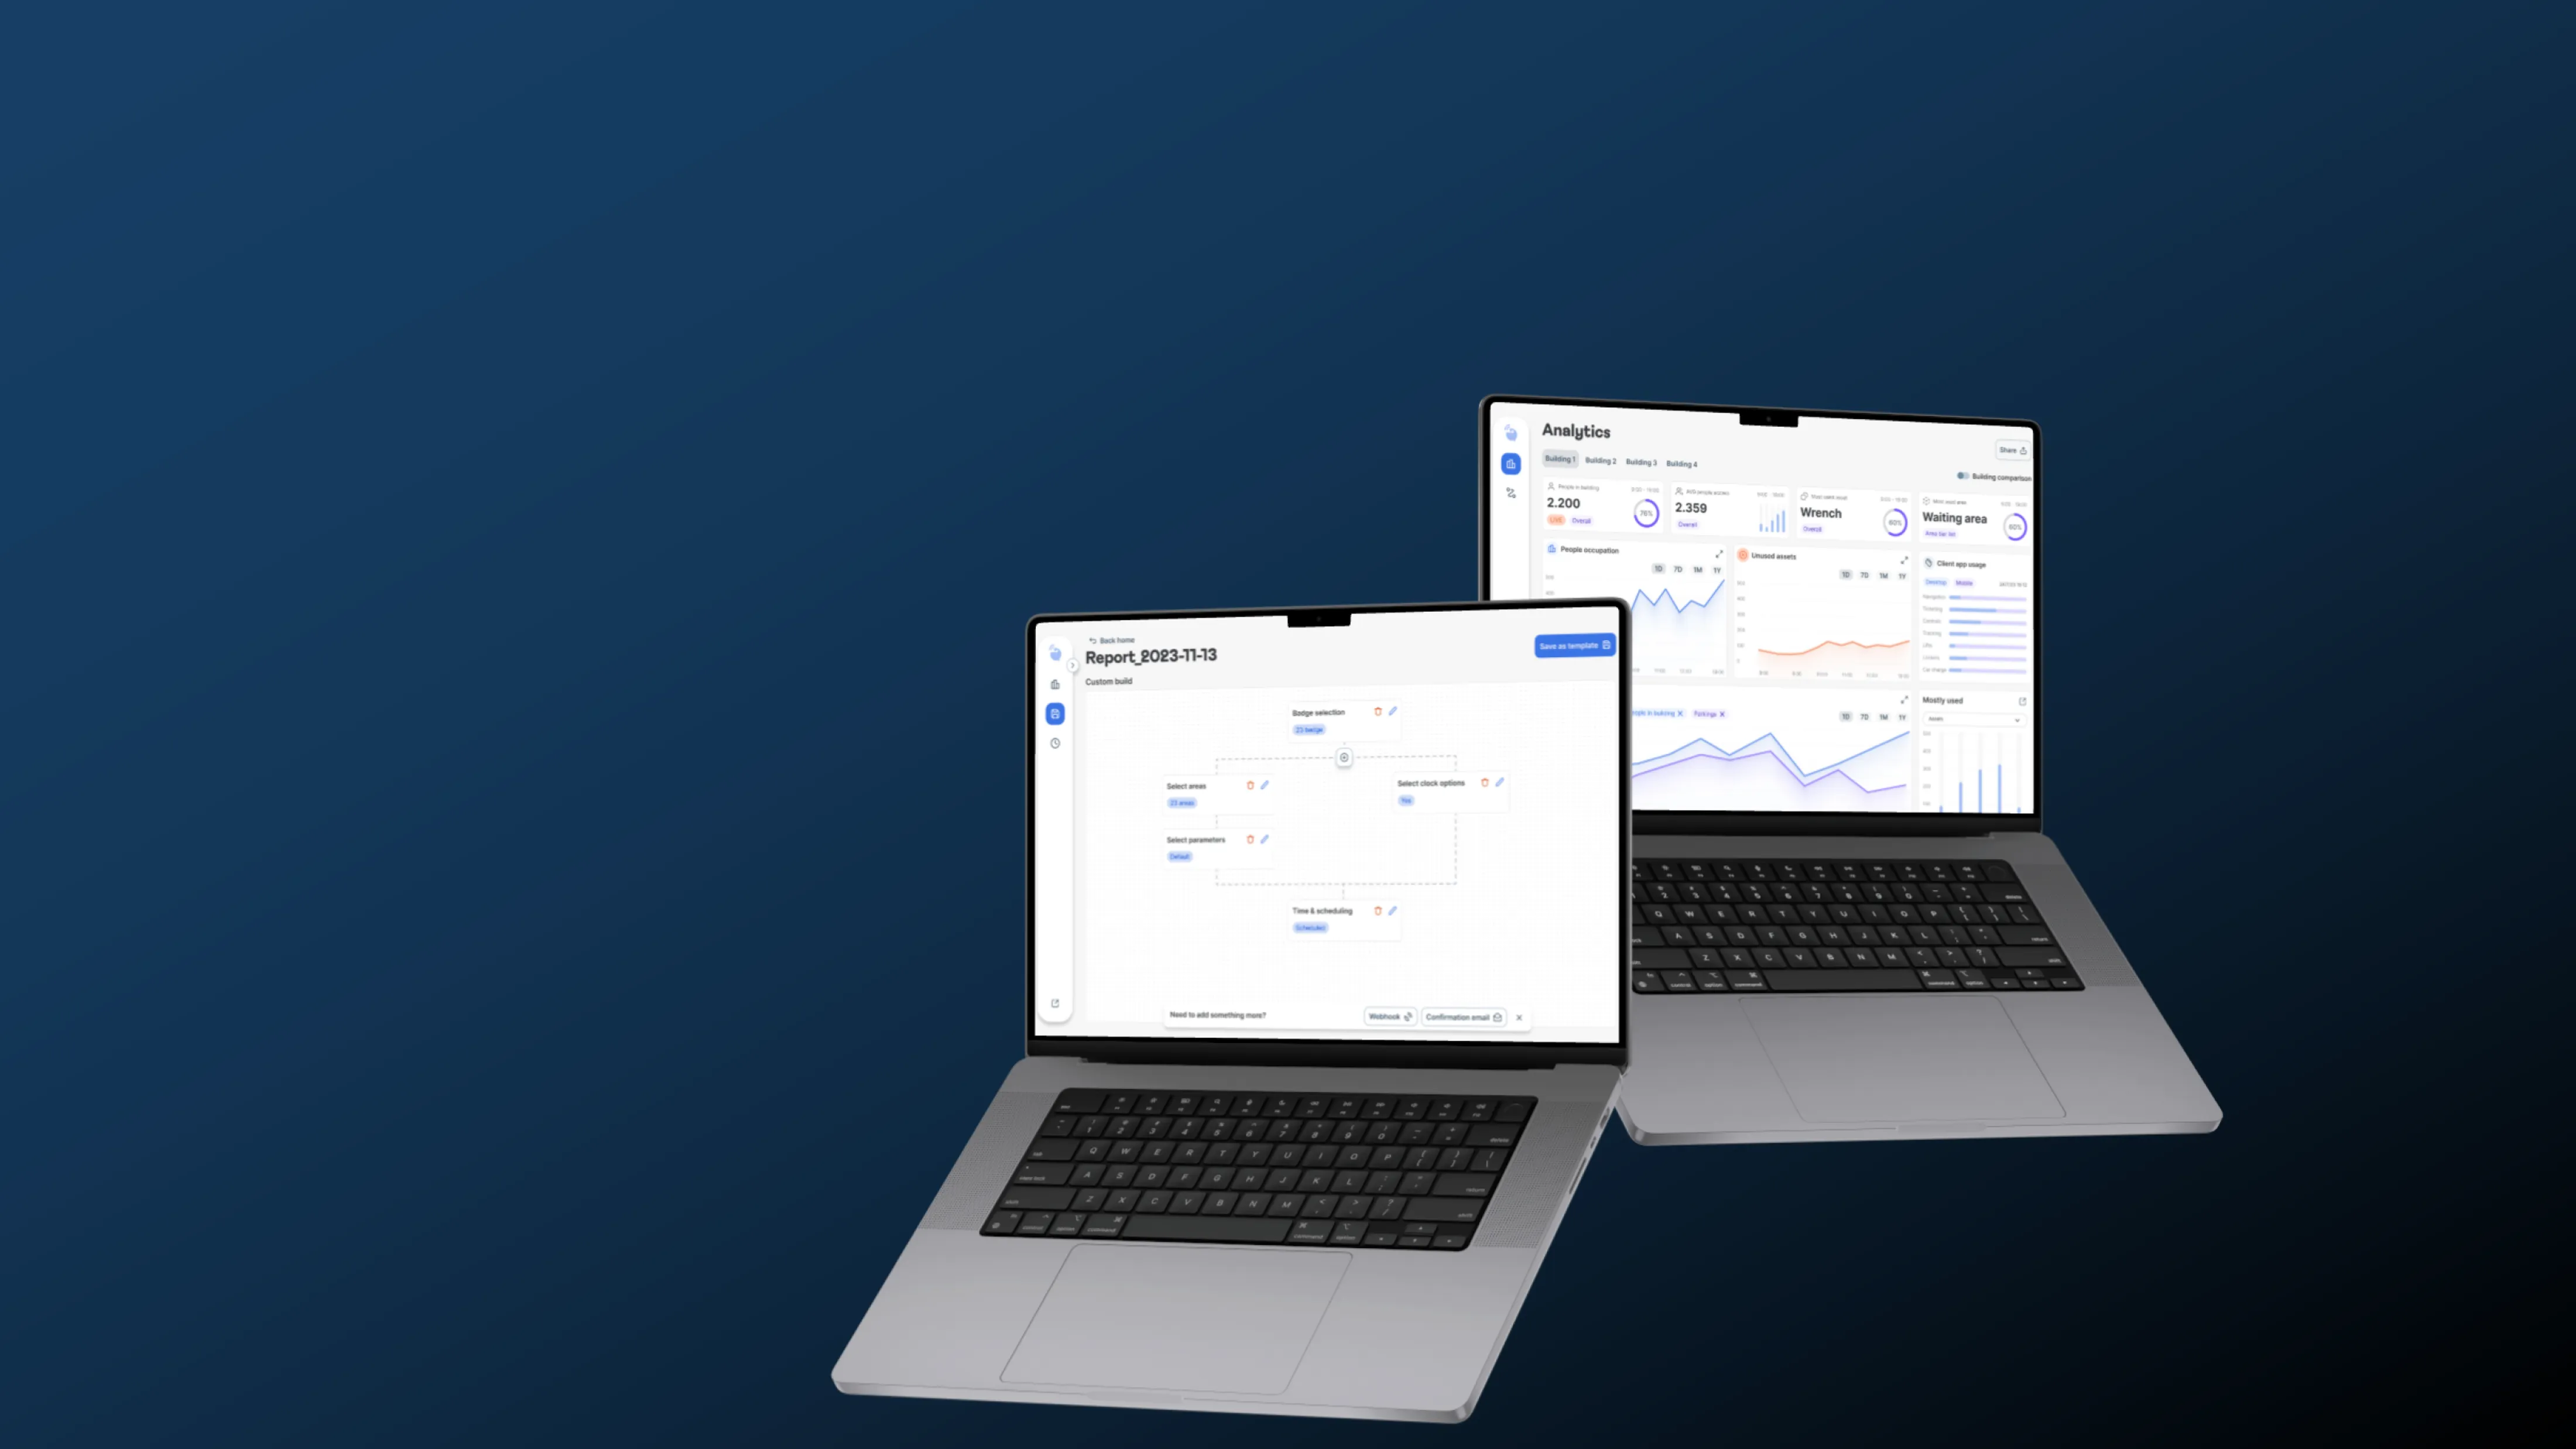
- Use heat maps and track reports to review where people, assets, or objects spend time, how they move, and where delays or repeated movement may point to process waste.
- Review movement paths, events, and last-known positions to check whether physical workflows follow the expected route, sequence, or operating rule.
- Use event and alarm lists to identify exceptions, missed steps, dwell issues, or process breaks as they occur. Use evidence to improve layouts, rules, staffing, and workflows.